
Grafana recently published a case study on why MarshallZehr adopted Grafana. Our use is pretty standard – send logs and metrics from every application and server to one place where we can visualize, diagnose, and alert on issues, allowing us to respond proactively rather than reactively.
If you look closely, you’ll notice one of our dashboards is a bit unusual:
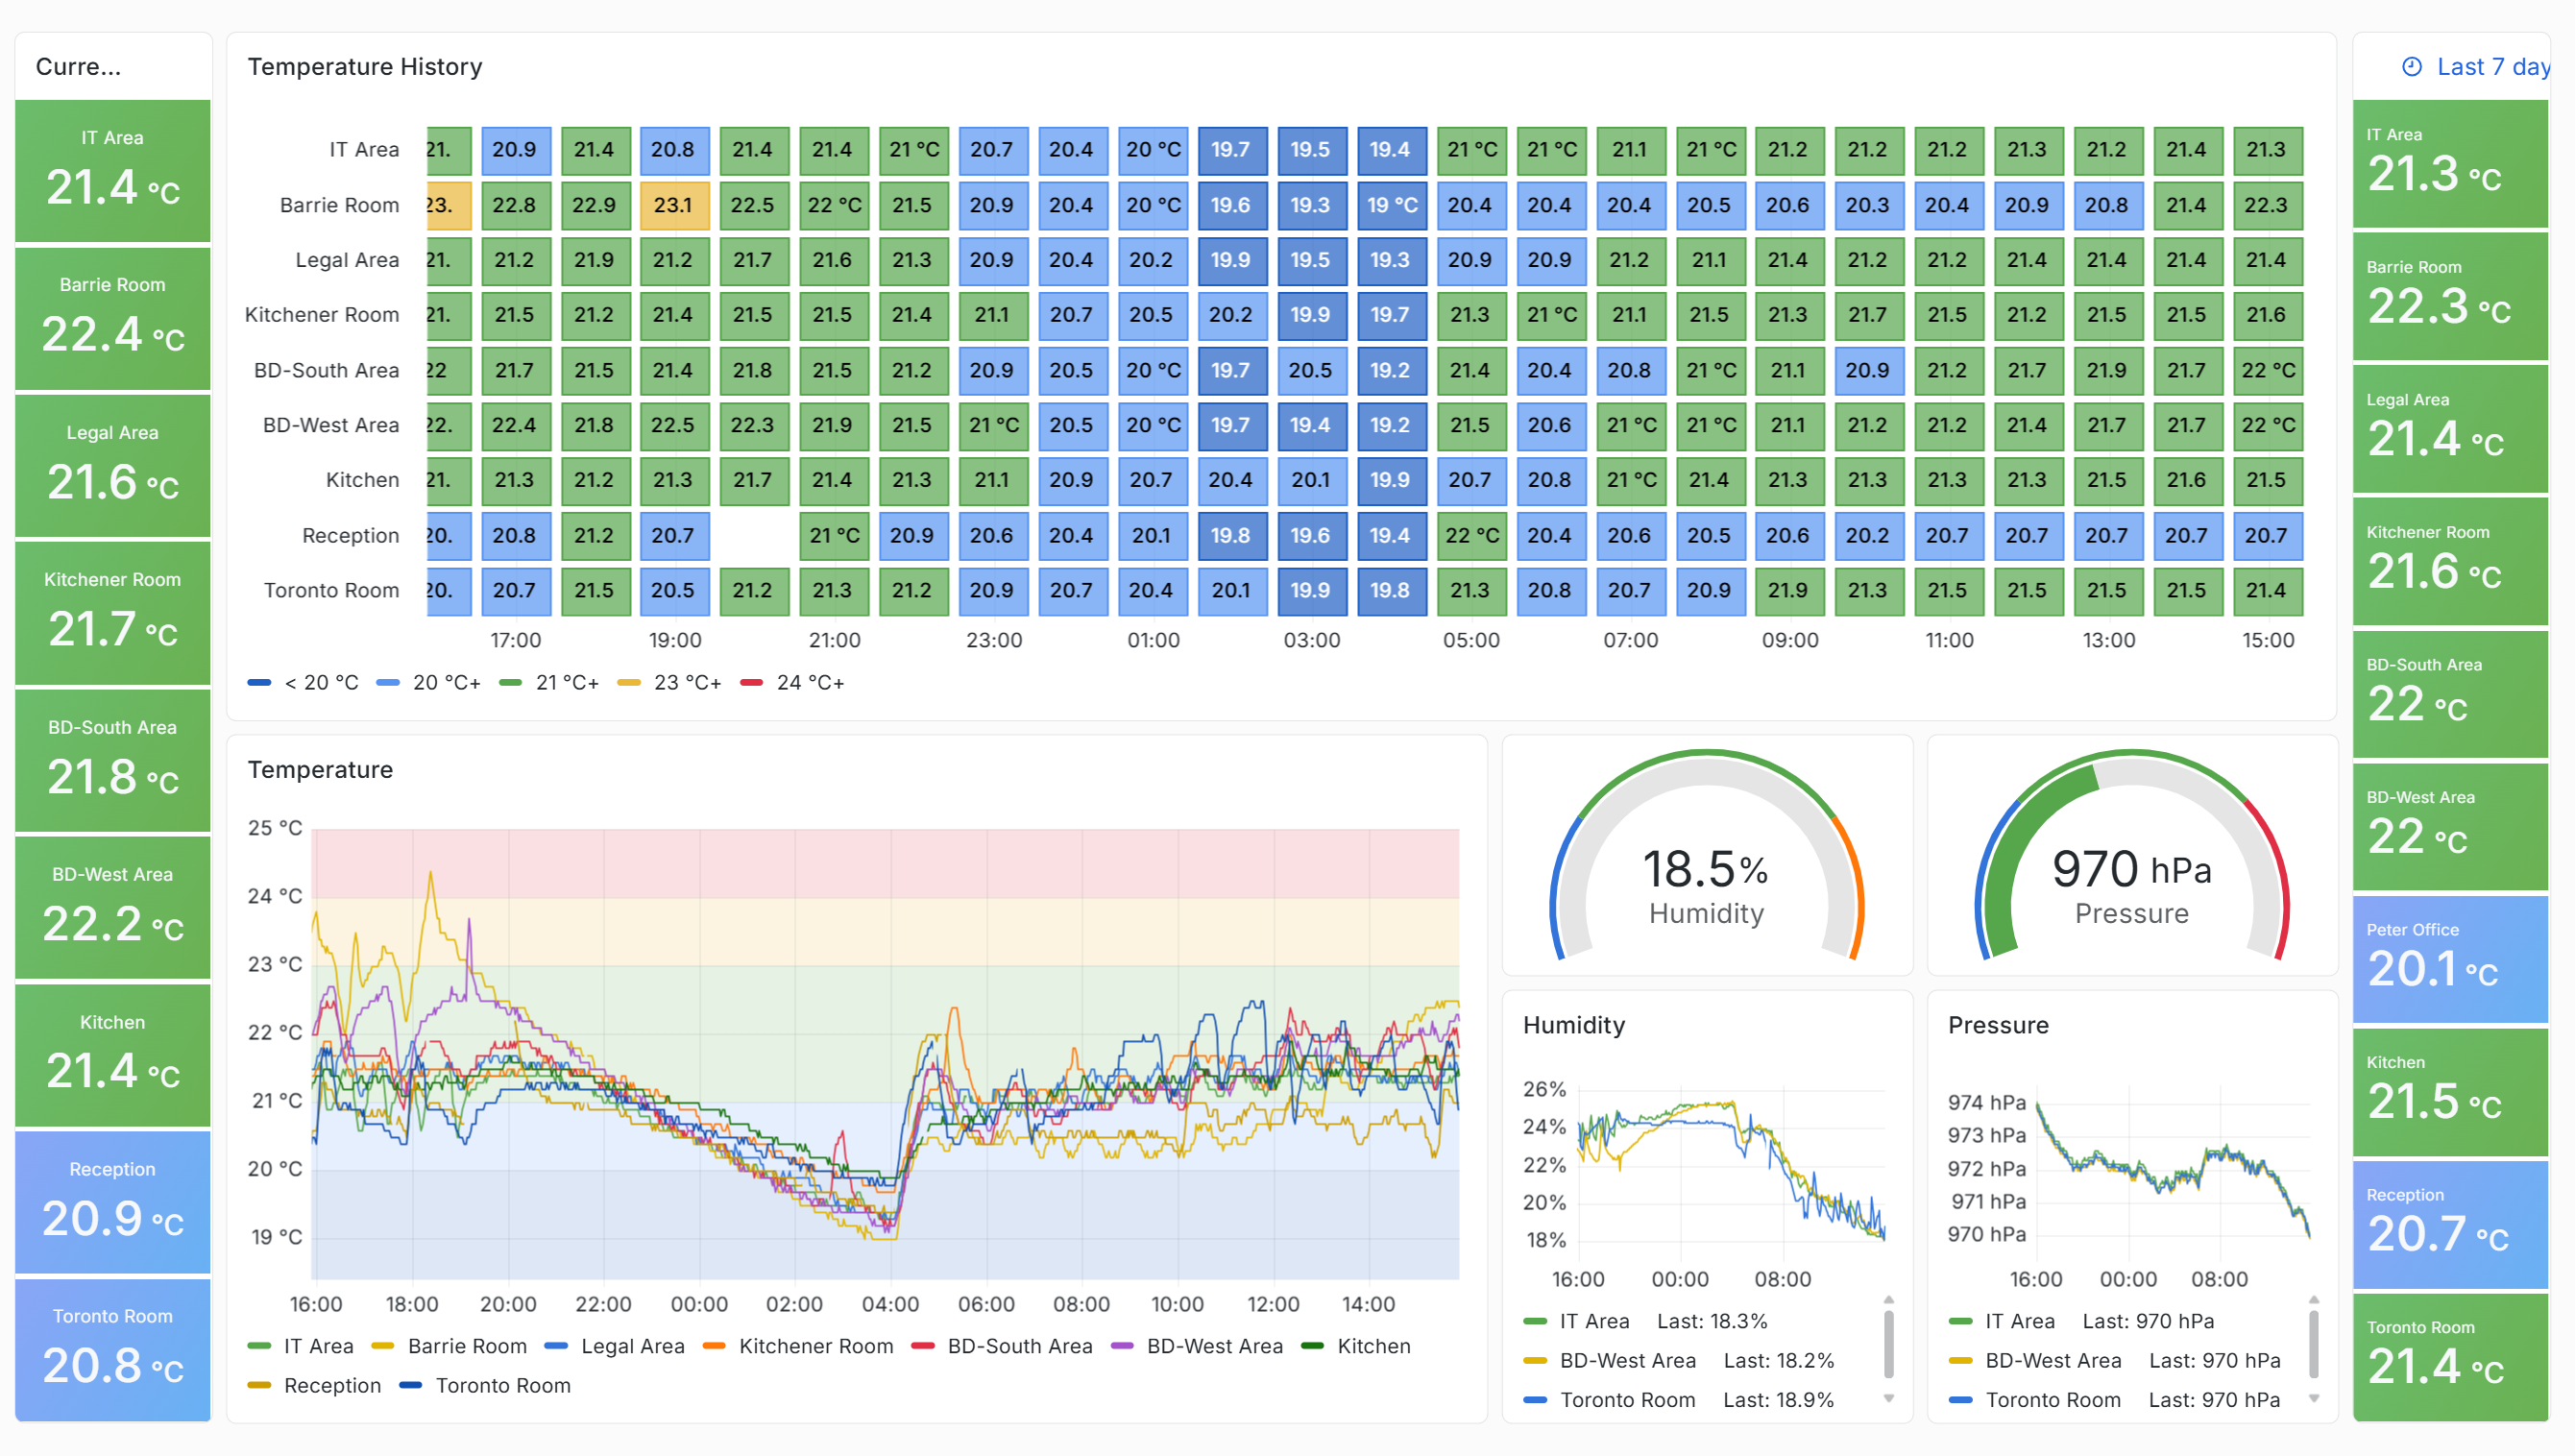
That’s right – I have a dashboard with the temperature in 9 different zones of the MarshallZehr office. But why?
The problem
Shortly after moving back in to our rebuilt office, complaints started rolling in: Too cold! Too hot! A bad experience for our visitors! The temperature was indeed a problem – we had some rooms at 18.5°C, and others approaching 27°C. We had hot rooms that would only get hotter, some that would swing wildly, and some that had no discernible pattern at all. Problems would appear and disappear daily.
Our landlord dispatched the HVAC company for repairs – but other than a small tweak here and there, they found little wrong. That’s just how commercial HVAC systems behave, they said. Of course, by the time they arrived days later the problem would have long passed. Or they’d guess at a fix, and a week later we’d be having exactly the same problems again.
Leadership expected consistent temperatures. The HVAC company said everything was working. How could we break the impasse?
My solution
Whenever I’m investigating a tricky application issue, Grafana is my first stop. Graphing resource usage, activity, or other metrics can quickly eliminate possible causes, surface correlations, and identify the culprit. If only I had similar insight into our office! But… maybe I could?
At home, both my Ecobee thermostat and IKEA air quality sensor publish temperature into Home Assistant, which will graph any sensor over time. I couldn’t use the office thermostats; they were commercial units with no public API. Deploying home assistant, a zigbee mesh, and a dozen zigbee sensors would have been over $500 – cheaper than a service call, but more than I wanted to spend on a hunch. Wi-Fi sensors would skip the Zigbee mesh, but cost more per unit, and I’d still need to get the data somewhere.
For once, this wasn’t a hardware problem – microcontrollers with Wi-Fi are less than $5, and accurate-enough temperature sensors about the same; add a USB cable and a cheap charger and we’re under $15/unit. I just needed a way to collect the data – without writing a lot of code.
That’s when I discovered the ESPHome Prometheus component. With a simple YAML configuration, every microcontroller could have a metrics endpoint that my existing Prometheus service could scrape and push into Grafana!
To make assembly quick, I designed a small PCB with EasyEDA and sent it to JLCPCB to manufacture. After assembling and flashing ESPHome, I had a fleet of temperature monitors ready to deploy around the office.
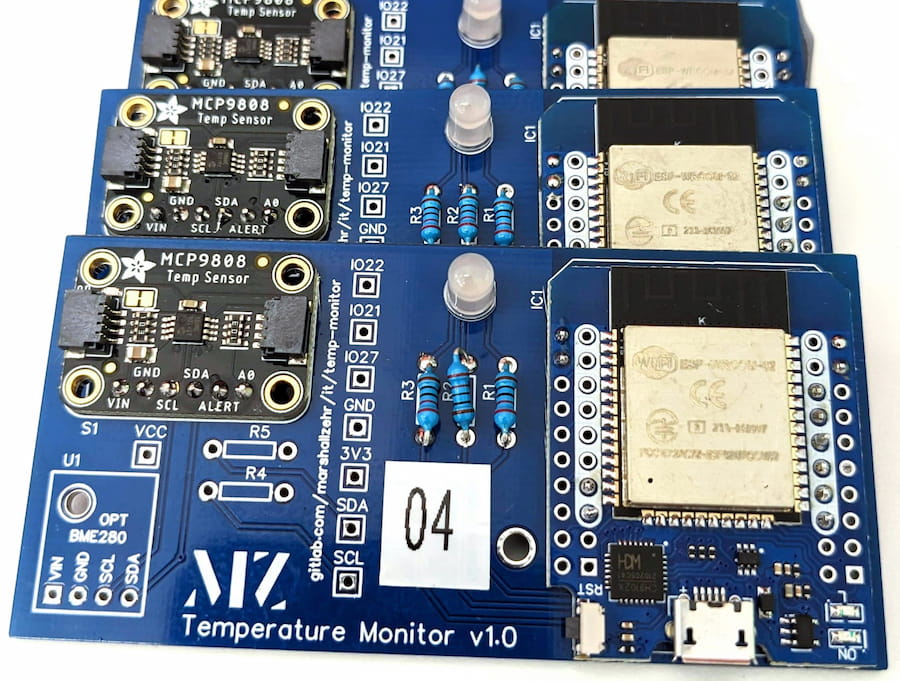
Each temperature monitor consisted of:
- ESP-32 variant of the WEMOS D1 Mini
- Adafruit MCP9808 temperature sensor (typical accuracy of ±0.25°C)
- Optional Bosch BME280 humidity/pressure sensor
After assembly, I ran the monitors for a few days all sitting next to each other and a Thermoworks instant-read thermometer. They were precise, but not accurate; to calibrate, I added an offset to each in ESPHome. This brought them all within ±0.3°C of my reference.
The results
Once we could see minute-by-minute data across the whole office, problems jumped out quickly. Wild temperature swings, stubbornly hot or cold areas, areas that barely changed when heating or cooling – clear as day. I started including annotated graphs in our HVAC service calls; at one point, one of the technicians sent me a data dump from the HVAC controller so I could overlay the control signal for each rooftop unit onto my measurements.
Across a few rounds of debugging and fixes, we found:
- A few dampers that were almost completely shut, limiting airflow to some locations
- No isolation between thermostats and the wall cavity, leading to inaccurate measurements on exterior walls and service cavities
- A “vibe coded” control algorithm with numerous bugs:
- An emergency heat mode that ran every morning and would not start cooling until it had first heated all zones past their setpoint
- Heat/cool control based on a 1-vote-per-thermostat system rather than minimizing total temperature error – so four thermostats 0.25°C above setpoint and one 4°C below setpoint would make the system cool the already-cold room even further!
- “Energy saving” behaviour that would shut the system down overnight, allow temperatures to fall to 15°C, and then run full blast for hours at 7 AM as the first staff arrived
- Meeting rooms marked as offices, allowing staff to drop the setpoint by 4°C in a futile attempt to convince the system to cool – which then froze out the next people in the meeting room hours later
- Locked-down temperature zones reverting to unlocked, at a different setpoint than the one it was locked to
As the HVAC company repaired dampers, isolated thermostats, tweaked the control algorithm, and locked out thermostats to prevent changes, the wild temperature swings became less frequent – and eventually stopped. There are still days when it’s a little too warm, cold, or humid; but the days of roasting people out of meeting rooms while turning others into meat lockers are over!
All because Grafana gave us insight into what was happening, when, and where – so that the professionals could finally wring the bugs out of the system.
So the next time you have a heating or cooling issue – consider Grafana!